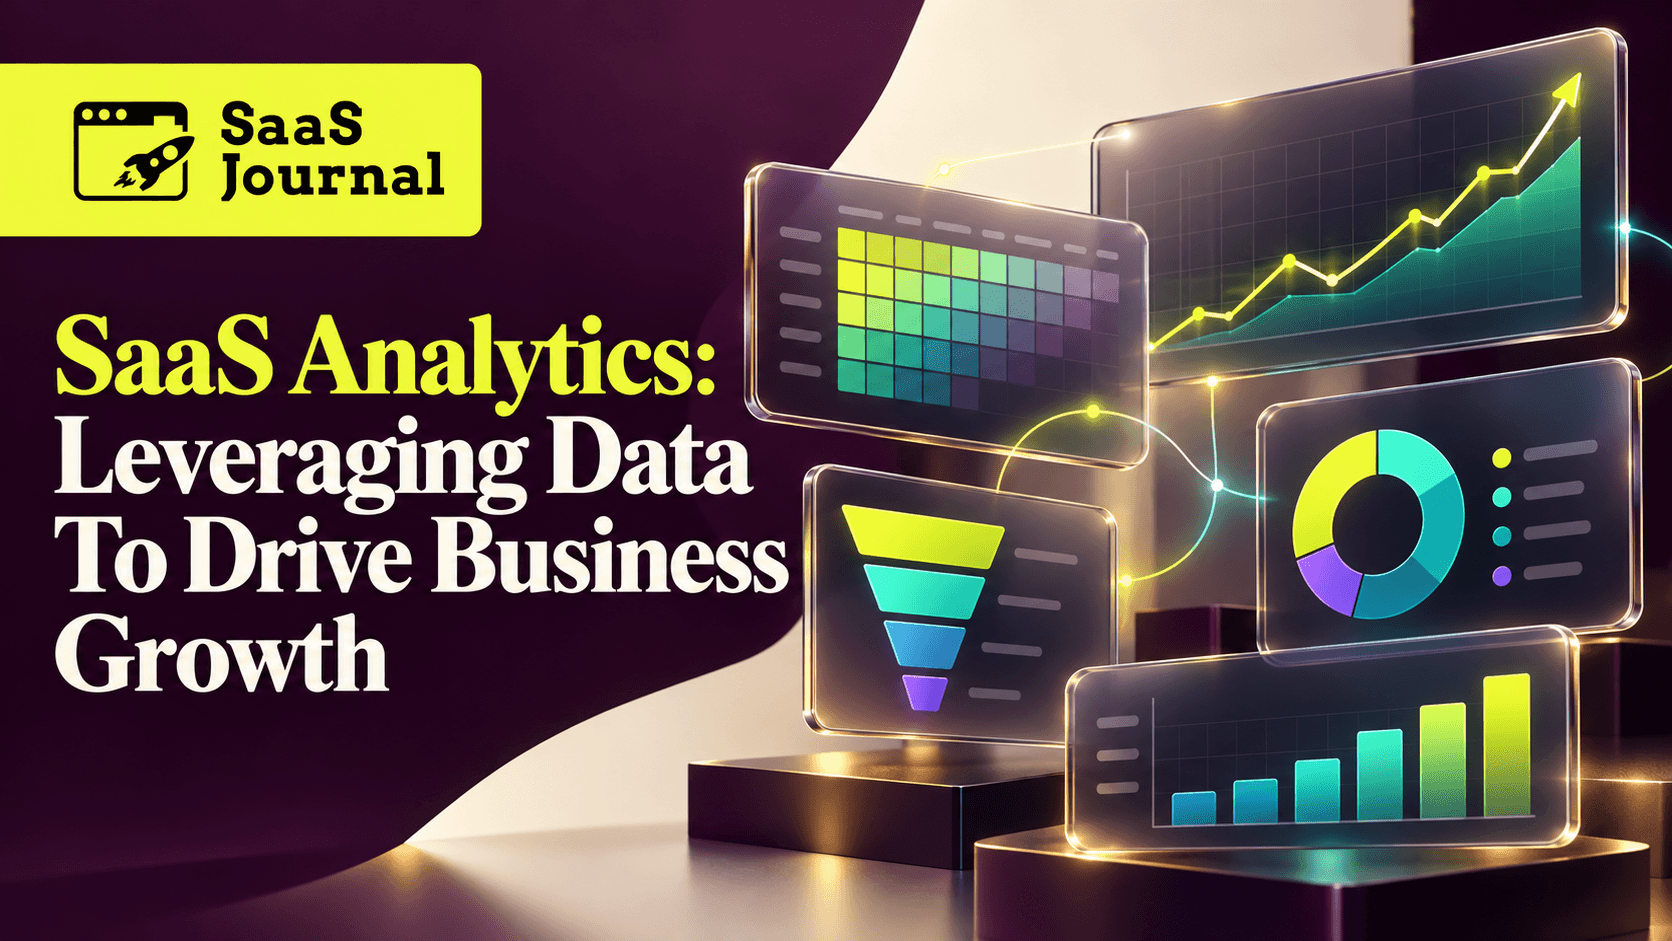
SaaS analytics is the process of collecting, measuring, and analyzing data related to a software subscription business.
By tracking recurring revenue, customer acquisition costs, retention, product engagement, and customer lifetime value, companies can make more informed decisions.
Collecting data is not enough: businesses must define meaningful metrics, maintain reliable data, and translate insights into practical improvements.
Data has become one of the most valuable assets for Software-as-a-Service (SaaS) companies.
Every customer interaction, subscription payment, product feature, and marketing campaign generates information that can help businesses understand performance and identify growth opportunities.
However, collecting data alone does not guarantee success.
SaaS companies must transform raw information into meaningful insights that support better decisions.
This is where SaaS analytics plays an important role.
From tracking monthly recurring revenue to identifying customers at risk of cancellation, analytics helps companies understand what drives growth and where improvements are needed.
In 2026, artificial intelligence, automated reporting, and product analytics are making data-driven decision-making more accessible to businesses of different sizes.
For SaaS founders and marketing leaders, understanding these capabilities is essential for building profitable and sustainable software businesses.
Let's explore what SaaS analytics means, the metrics that matter most, and how companies can use data to improve acquisition, retention, and revenue.
What Is SaaS Analytics?
SaaS analytics refers to the process of collecting, measuring, and analyzing data related to a software subscription business.
It helps organizations evaluate customer behavior, financial performance, product engagement, and operational efficiency.
Unlike traditional businesses that primarily measure one-time sales, SaaS companies must monitor recurring revenue and ongoing customer relationships.
Common applications include:
-
Subscription revenue tracking.
-
Customer acquisition analysis.
-
Product usage monitoring.
-
Customer churn measurement.
-
Marketing performance evaluation.
-
Customer lifetime value estimation.
-
Revenue forecasting.
For example, a SaaS company might discover that customers who complete a specific onboarding process are more likely to remain subscribed.
This insight could help the business improve onboarding and customer engagement.
Stripe's SaaS metrics guide explains how financial and operational indicators help subscription businesses understand performance.
The objective of SaaS analytics is not simply creating dashboards. It is using reliable information to support better business decisions.
Why SaaS Analytics Matters for Business Growth
SaaS businesses depend on recurring revenue, customer satisfaction, and long-term product adoption.
Without reliable analytics, companies may struggle to identify why customers cancel subscriptions or why acquisition costs increase.
Analytics provides visibility into important business activities.
Better Customer Understanding
Businesses can identify how customers use their software and which features deliver the most value.
Improved Revenue Visibility
Financial metrics help companies understand recurring revenue trends and subscription performance.
Reduced Customer Churn
Analytics can identify patterns associated with customer disengagement.
More Efficient Marketing
Businesses can evaluate which acquisition channels generate valuable customers.
Stronger Product Development
Feature usage information can help product teams prioritize improvements.
These capabilities make SaaS analytics an important foundation for sustainable growth.
However, useful analysis requires accurate data, consistent metric definitions, and appropriate interpretation.
1. Track Monthly Recurring Revenue (MRR)
Monthly recurring revenue is one of the most important metrics for subscription businesses.
MRR represents the normalized recurring subscription revenue generated each month.
As an illustrative example, if a SaaS company has 200 customers paying $50 per month, its MRR is:
200 × $50 = $10,000
However, businesses with multiple subscription plans, annual contracts, discounts, and upgrades require more detailed calculations.
MRR can be divided into several categories.
New MRR
Recurring revenue generated from newly acquired customers.
Expansion MRR
Additional recurring revenue from existing customers who upgrade or purchase additional services.
Contraction MRR
Recurring revenue lost when existing customers downgrade their subscriptions.
Churned MRR
Recurring revenue lost when customers cancel.
Tracking these components helps businesses understand whether growth comes from new customer acquisition or expansion within existing accounts.
MRR should also be reconciled with billing records to maintain financial accuracy.
2. Measure Customer Acquisition Cost (CAC)
Customer acquisition cost measures the cost of acquiring a new paying customer.
It helps SaaS businesses understand the efficiency of their sales and marketing efforts.
A simplified formula is:
Customer Acquisition Cost = Sales and Marketing Expenses ÷ New Customers Acquired
For example, if a company spends $20,000 on sales and marketing during a period and acquires 100 customers, its average CAC is $200.
However, companies must define which expenses are included and align spending with the period in which customers are acquired.
Useful CAC analysis includes:
-
Paid advertising acquisition cost.
-
Organic customer acquisition.
-
Sales-assisted acquisition.
-
Partner-generated customers.
-
Customer acquisition by industry.
For example, a company might discover that customers acquired through educational content cost less than those acquired through paid advertising.
This information can guide future marketing investment.
CAC should be evaluated alongside customer lifetime value and gross margins rather than viewed in isolation.
3. Understand Customer Lifetime Value (LTV)
Customer lifetime value estimates the economic value generated by a customer throughout their relationship with a business.
For SaaS companies, LTV helps determine how much they can reasonably invest in customer acquisition.
A simplified subscription LTV estimate is:
LTV = Average Monthly Revenue per Customer × Gross Margin Percentage ÷ Monthly Customer Churn Rate
This formula assumes relatively stable revenue, margins, and churn.
For example, if a customer generates $100 monthly revenue, the gross margin is 80%, and monthly customer churn is 4%, the estimated LTV is:
$100 × 0.80 ÷ 0.04 = $2,000
Actual customer value may differ because of upgrades, downgrades, customer segments, and changes in retention.
Comparing LTV with CAC helps founders evaluate whether acquisition strategies are economically sustainable.
Businesses should also measure how long it takes to recover customer acquisition costs.
4. Analyze Customer Churn and Retention
Customer churn measures the percentage of customers who discontinue their subscriptions during a specified period.
High churn can weaken recurring revenue growth, even when new customer acquisition is strong.
A simplified customer churn formula is:
Customer Churn Rate = Customers Lost During Period ÷ Customers at Start of Period × 100
For example, if a company begins the month with 500 customers and loses 20, its monthly customer churn rate is 4%.
However, customer churn and revenue churn are different.
A business may lose several small accounts while retaining most of its recurring revenue.
SaaS analytics should therefore measure both customer retention and revenue retention.
Net Revenue Retention
Net revenue retention (NRR) measures how recurring revenue changes within an existing customer cohort after accounting for expansion, contraction, and churn.
Stripe's net revenue retention guide explains why this metric is important for understanding growth generated from existing customers.
NRR above 100% indicates that expansion revenue exceeded contraction and churn within the measured cohort.
However, strong NRR can sometimes hide underlying customer losses, so companies should monitor customer churn and gross revenue retention as well.
5. Use Product Analytics to Understand User Behavior
Product analytics helps SaaS companies understand how customers interact with their software.
Instead of relying exclusively on subscription data, businesses can examine which features users adopt and where they experience difficulties.
Important metrics include:
-
User activation rate.
-
Feature adoption.
-
Daily active users.
-
Monthly active users.
-
Session frequency.
-
Onboarding completion.
-
Trial-to-paid conversion.
-
Customer engagement.
For example, a project management platform might discover that users who invite teammates during onboarding demonstrate stronger retention.
The company could then test whether simplifying team invitations improves activation.
Amplitude's product metrics guide explains how engagement, retention, activation, and monetization metrics can support product decisions.
However, product teams should avoid treating every usage increase as evidence of improved customer value.
The objective is understanding whether customers successfully achieve meaningful outcomes.
6. Improve SaaS Marketing Performance With Analytics
Marketing analytics helps businesses understand which campaigns generate qualified leads and paying customers.
SaaS companies often invest in search engine optimization, content marketing, paid advertising, email campaigns, and social media.
Analytics can help evaluate the contribution of these channels.
Important metrics include:
-
Website conversion rate.
-
Cost per qualified lead.
-
Trial registration rate.
-
Demo booking rate.
-
Trial-to-paid conversion.
-
Customer acquisition cost.
-
Marketing-sourced revenue.
For example, a SaaS company may discover that educational articles generate fewer immediate conversions than paid campaigns but attract customers with stronger long-term retention.
This information could influence how marketing budgets are allocated.
The growing role of AI and automation in SaaS marketing is also creating opportunities to connect campaign information with customer behavior and subscription outcomes.
However, attribution models have limitations.
Businesses should combine marketing analytics with experiments and broader financial measurements.
7. Use Predictive Analytics to Identify Growth Opportunities
Predictive analytics uses historical information and statistical models to estimate potential future outcomes.
For SaaS companies, applications include:
Customer Churn Prediction
Identify customers showing patterns associated with cancellation.
Revenue Forecasting
Estimate future subscription revenue using customer and billing information.
Lead Scoring
Prioritize prospects based on characteristics and engagement behavior.
Expansion Opportunity Detection
Identify customers who may benefit from additional features or higher subscription tiers.
Product Usage Forecasting
Estimate future infrastructure demand based on customer activity.
These capabilities are closely connected to broader AI-powered SaaS trends in 2026.
However, predictive systems require reliable information and ongoing evaluation.
Companies should treat predictions as decision-support tools rather than guaranteed outcomes.
8. Build SaaS Analytics Dashboards
Dashboards help businesses visualize performance indicators in a centralized interface.
Instead of reviewing disconnected spreadsheets, teams can monitor relevant information through charts, tables, and automated reports.
A SaaS executive dashboard might include:
-
Monthly recurring revenue.
-
Annual recurring revenue.
-
Customer acquisition cost.
-
Customer churn.
-
Net revenue retention.
-
Active subscriptions.
-
Trial-to-paid conversion.
-
Revenue growth.
Marketing teams may need dashboards focused on lead generation and campaign performance.
Customer success teams may prioritize engagement, retention, and renewal information.
Microsoft Power BI documentation provides guidance on connecting data sources, creating reports, and building analytical dashboards.
However, dashboards should remain focused.
Displaying too many metrics can make it difficult to identify meaningful changes.
Each dashboard should support specific business decisions.
9. SaaS Analytics Helps Improve Customer Retention
Retention analytics provides insight into why customers continue using software or decide to cancel.
Businesses can combine information from product usage, support interactions, billing records, and customer feedback.
For example, a SaaS company might identify that customers who fail to complete onboarding within their first week are more likely to cancel.
The company could test new onboarding tutorials or personalized assistance.
Potential retention strategies include:
-
Usage-based customer engagement.
-
Automated onboarding reminders.
-
Customer satisfaction surveys.
-
Feature education.
-
Renewal preparation.
-
Customer success outreach.
For founders exploring Micro-SaaS opportunities in 2026, retention analytics can be particularly valuable because smaller subscription businesses often depend heavily on long-term customer relationships.
However, customer behavior should be interpreted in context.
Lower product usage does not always indicate dissatisfaction.
Some applications deliver value through occasional rather than frequent interactions.
10. Analyze SaaS Pricing and Revenue Expansion
Pricing has a direct influence on SaaS revenue and customer retention.
Analytics can help companies understand how different subscription tiers perform.
Important areas include:
-
Subscription plan adoption.
-
Upgrade frequency.
-
Downgrade patterns.
-
Revenue per customer.
-
Feature usage by plan.
-
Price sensitivity.
-
Expansion revenue.
For example, a SaaS company might discover that customers frequently exceed the limits of a particular subscription tier.
This could indicate an opportunity to introduce a more suitable plan.
However, pricing decisions should consider customer feedback, competitive alternatives, and product value.
Analytics should inform pricing strategy without automatically determining what customers should pay.
11. Common SaaS Analytics Mistakes to Avoid
Despite its benefits, SaaS analytics can produce misleading conclusions when implemented poorly.
Tracking Too Many Metrics
Monitoring dozens of indicators without clear objectives creates unnecessary complexity.
Using Inconsistent Definitions
Different teams may calculate churn, revenue, or customer acquisition cost differently.
Ignoring Data Quality
Incomplete billing records and duplicated customer information can distort results.
Confusing Correlation With Causation
A feature associated with higher retention may not directly cause customers to remain subscribed.
Focusing Only on Revenue Growth
Revenue growth should be evaluated alongside profitability, retention, and customer acquisition efficiency.
Neglecting Customer Privacy
Businesses must collect, store, and analyze customer information responsibly.
Avoiding these mistakes helps organizations build more reliable analytics practices.
12. How to Implement a SaaS Analytics Strategy
Building an effective analytics system requires a structured approach.
Step 1: Define Business Objectives
Identify which decisions analytics should support.
Examples include reducing churn, improving activation, or increasing recurring revenue.
Step 2: Select Important Metrics
Choose indicators directly connected to those objectives.
Step 3: Connect Relevant Data Sources
Integrate subscription billing, CRM, product usage, and marketing information where appropriate.
Step 4: Establish Data Quality Standards
Maintain consistent definitions, validation processes, and access controls.
Step 5: Build Focused Dashboards
Create reports tailored to executives, marketing teams, product managers, and customer success teams.
Step 6: Analyze Trends
Review performance regularly and investigate unusual changes.
Step 7: Test Improvements
Use experiments and customer feedback to evaluate potential solutions.
Step 8: Measure Business Outcomes
Determine whether changes improve retention, revenue, efficiency, or customer satisfaction.
This process helps SaaS companies move from passive reporting toward data-informed decision-making.
SaaS Analytics Tools and Pricing
The tools mentioned in this article — Stripe Billing, Amplitude, and Microsoft Power BI — cover different parts of the analytics stack, from billing data to product usage to dashboards.
Dedicated subscription analytics products such as ChartMogul and Baremetrics focus more narrowly on the metrics covered above, including MRR, churn, and net revenue retention.
Pricing as of November 2026, taken from each vendor's own pricing page. Vendors change plans and prices regularly, so confirm current pricing on the linked pages before committing.
| Tool | What it is used for | Starting price / free tier (as of November 2026) | Source |
|---|---|---|---|
| Stripe Billing | Subscription billing and invoicing; the billing data behind MRR and churn calculations. | Pay as you go: 0.7% of Billing volume (includes Billing transactions processed on and off Stripe; excludes one-off invoices). Custom pricing via sales for larger businesses. | stripe.com/billing/pricing |
| Stripe Revenue Recognition | Accounting automation and revenue reporting on top of billing data. | 0.25% of volume, reduced to 0.2% when monthly volume exceeds $100,000; 30-day free trial. | stripe.com/revenue-recognition/pricing |
| Amplitude | Product analytics: activation, feature adoption, engagement, and retention. | Free plan with up to 2M events per month; the Plus plan is listed as starting at $0 with the first 2M events per month free; Growth and Enterprise plans use custom, event-based pricing (pricing on request). | amplitude.com/pricing |
| Microsoft Power BI | Dashboards and business intelligence reporting across connected data sources. | Free plan available; Pro at $14.00 per user/month and Premium Per User at $24.00 per user/month, both paid yearly (Microsoft notes actual list price appears at checkout). | microsoft.com Power BI pricing |
| Mixpanel | Product analytics: events, funnels, retention, and session replay. | Free plan with up to 1M events per month; the Growth plan starts at $0 (first 1M events free), then for example $100 per month for 1.5M events per month billed yearly ($140 billed monthly); Enterprise pricing on request. | mixpanel.com/pricing |
| ChartMogul | Subscription analytics: MRR, churn, and net revenue retention computed from billing data. | Free plan for businesses up to $120K ARR; Starter from $69 per month billed monthly ($57 per month billed annually); Enterprise from $19,900 per year, billed annually. | chartmogul.com/pricing |
| Baremetrics | Subscription analytics dashboards for MRR, churn, and forecasting. | Launch plan listed at $75 per month for businesses up to $360K ARR; Growth at $255 per month ($360K–$3.6M ARR); Scale at $1,152 per month ($3.6M+ ARR); annual plans discounted up to 35%. | baremetrics.com/pricing |
Most of these vendors also offer startup programs or custom plans, so the right starting point depends on company stage and data volume.
The Future of SaaS Analytics
SaaS analytics will continue evolving as AI-powered reporting, predictive models, and automated workflows become more accessible.
Businesses may increasingly use natural-language interfaces to explore operational information.
For example, executives could ask analytical systems why subscription revenue declined or which customer segments experienced increased churn.
AI tools may help identify patterns and generate initial explanations.
However, reliable analytics will still depend on accurate data, transparent calculations, and human judgment.
SaaS companies that develop strong analytics foundations will be better prepared to adopt these capabilities.
Conclusion
SaaS analytics plays an essential role in helping software businesses understand performance and identify growth opportunities.
By tracking recurring revenue, customer acquisition costs, retention, product engagement, and customer lifetime value, companies can make more informed decisions.
Predictive analytics and automated dashboards can further improve operational visibility.
However, successful analytics requires more than collecting large amounts of information.
Businesses must define meaningful metrics, maintain reliable data, and translate insights into practical improvements.
For SaaS founders and business leaders, the greatest value of analytics comes from using data to solve customer problems and build sustainable recurring revenue.
The future of SaaS growth will depend not simply on how much data companies collect, but on how effectively they use that information to make better decisions.